As far as I can tell the last breach of the AQNES for nitrogen dioxide happened in 2022 at Auckland coming after at least a decade of falling concentrations. It looked like maybe NO2 was yesterday’s pollutant.
Then late in 2021 the World Health Organisation slashed its guideline for annual mean NO2 from 40 mg m-3 to only 10 mg m-3. Shortly thereafter the HAPINZ v3 study seemed to overturn the orthodoxy that particulate matter was the biggest air quality issue in NZ, by showing that NO2 from traffic was posing the greater burden on health. Suddenly, nitrogen dioxide went from being a pollutant a few Councils might monitor in one or two locations to one that agencies involved in air quality management needed to take a more substantive and informed position on.
Fortunately, our team, when we were at NIWA, working with the NZ Transport Agency and several councils, had spent the previous decade or more amassing a huge database of NO2 measurements right across the country. There have been several reports, but we thought this would be a good opportunity to present a quick and easy-to-digest rundown of the main things we learned in the process, and what they mean for air quality management.

Firstly, let us just take a moment to put some misunderstandings to bed. The WHO decision did not represent a change in scientific understanding – we did not discover that NO2 is more dangerous than we previously thought. What the change reflected was the filling of the gap in health effects data for exposures below the old guideline of 40 mg m-3, some of which came from research studies in “relatively” clean environments like Canada, specifically commissioned for this purpose. These studies confirmed adverse health effects right down to 10 mg m-3, and possibly below. Hence the change.
Secondly, it’s not that NO2 suddenly became more toxic, or more prevalent in New Zealand. It’s just that earlier HAPINZ assessments did not have access to sufficient NO2 data to base a health impacts calculation upon, and so it was not previously reported.
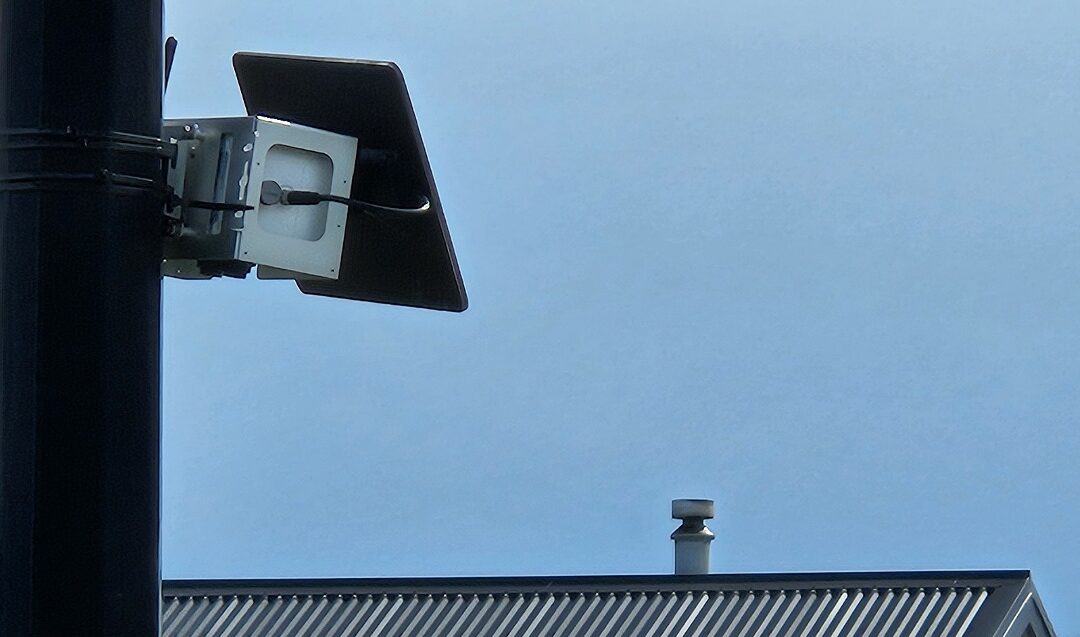
But now that data exists, largely in the form of diffusion tube samples. Of course, these samples give one number over a few weeks, and therefore provide no information about time of day. But their low cost and small form means they can be deployed almost anywhere in large numbers, giving substantial spatial information. Whereas NZTA run continuous sampling at sites mostly across the State Highway network, we have also conducted short “mapping” campaigns in at least 15 towns and cities from Whangarei to Invercargill. So, other than NO2 being significant, what else do these data show?
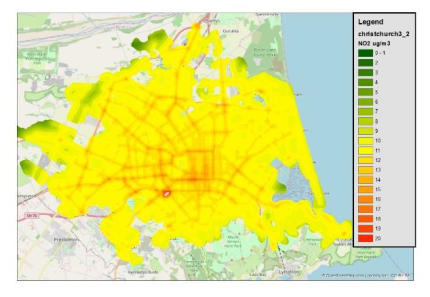
Firstly, NO2 overwhelmingly comes from traffic. Any map of NO2 looks just like a map of the road network. We have found limited evidence of slightly elevated NO2 around airports, sea ports and rail yards (See the map below for the modelled NO2 concentrations across Christchurch)
So, it’s a big city problem? Well, yes and no. We’ve found slightly higher concentrations in Auckland and Christchurch than elsewhere, but the different between cities is relatively small. What is much more pertinent is the way NO2 varies within a town or city.
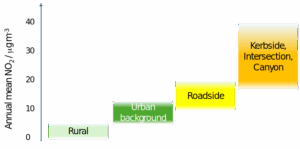
Most urban residents live in what we call “urban background” locations – generally more than 50 m from any major road (or further for the busiest roads). We have found that annual mean NO2 concentrations in most of these locations sits within a fairly narrow band of around 5 – 12 mg m-3, i.e. well below the old WHO guideline, but straddling the new WHO guideline.
A significant minority, however, tend to live in residences that sit in the range 10 – 50 m from a major road. In this zone we have found concentrations tend to range from 10 – 20 mg m-3.
Concentrations in the range 20 – 30 mg m-3 can be found, but only in some very specific and localised situations. This would be on the pavement, or kerbside alongside a busy road, and even then only if there is some degree of sheltering. Most frequently concentrations above 20 mg m-3 have only been observed close to traffic intersections, implying that acceleration and stop-start driving substantially increases emissions.
The highest concentrations we have measured over the years have nearly always been at very busy signalised intersections or in deep street canyons, like Auckland’s Queen Street. It is very much worth noting, however, that traffic volumes on Queen Street during the time NO2 has been monitored there, have been very low, being approximately 5,000 per day, compared to 200,000 on the busiest of Auckland’s motorways.
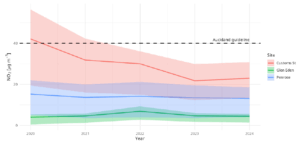
Finally, what about trends? With nearly 2 decades of data from the NZTA network we can clearly see that NO2 has been generally falling gradually at most locations. But there are exceptions. Analyses we have conducted on data from Auckland and Wellington seem to show that NO2 has stopped falling, and in some cases started to rise again alongside road sections where congestion has been increasing. This matches what we know from emission studies where stop-start driving cycles lead to higher emissions. This effect is potentially reduced by the use of hybrid engines.

Annual NO2 time series for selected sites in Auckland. From the recent “Ambient air quality in Auckland – trend analysis 2015 to 2024 – State of the environment reporting”
But NO2 can fall rapidly with the right intervention. NO2 on Auckland’s City centre – previously home to some of highest concentrations measured in the country – has seen a dramatic drop in recent years, with the annual mean falling from 44 mg m-3 in 2020 (despite COVID-19 lockdowns) to 18.5 mg m-3 in 2023. A smaller but nonetheless impressive drop (~40 %) was seen in Wellington’s Golden Mile between 2017 and 2022. These improvements coincided with major traffic restrictions (Auckland) and removal of older diesel buses (Wellington). The spatial extent of the improvements might be highly localised, but the benefits are experienced by the large population who use these spaces.
So, what can we do with all this new information? That’s for another time.


