For years, the emergence of low-cost sensors has offered a potential solution for councils to maintain environmental monitoring under continual pressure to reduce budgets. But used smartly, these sensors offer a whole lot more than just cost savings. They offer the chance to re-think how we do monitoring and solve some of the long-standing problems and shortcomings associated with the way we’ve traditionally done things.
![]() We’ve recently delivered an air quality monitoring plan for Horizons Regional Council that documents our latest ideas on how Councils can get more bang for their monitoring buck, gain insight into previously unmonitored airsheds, build community engagement and confidence in the representativeness of the data. Most of the ideas should apply right across the country and beyond.
We’ve recently delivered an air quality monitoring plan for Horizons Regional Council that documents our latest ideas on how Councils can get more bang for their monitoring buck, gain insight into previously unmonitored airsheds, build community engagement and confidence in the representativeness of the data. Most of the ideas should apply right across the country and beyond.
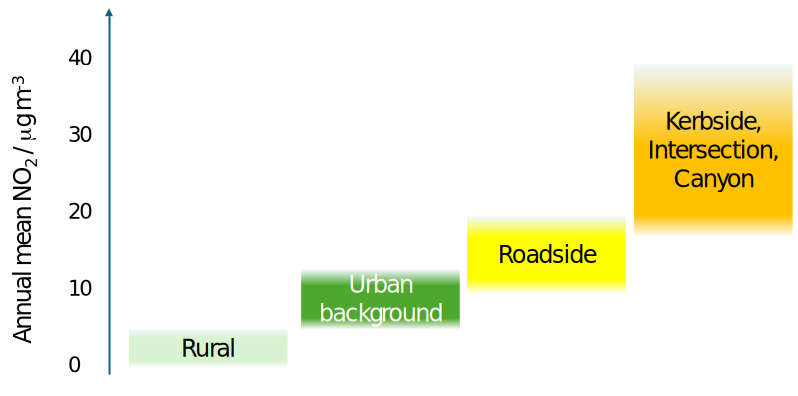
The project started, like many, with a conversation. The topic was a desire to be able to answer questions from the public and councillors, about air quality in towns where monitoring had not previously been done. New Zealand is a country of small and/or relatively isolated towns, many of which sit in sheltered valleys or basins and where open burning and solid fuel heating are not uncommon. The two decades of air monitoring conducted since the National Environmental Standards were introduced has made it abundantly clear that high PM levels in NZ are not a big city problem, but are just as common, if not more so, in these smaller towns, especially those inland. Their numerous and geographically scattered nature, however, makes them expensive to monitor.
Then there is the added complication that our regional background concentrations tend to be very low. A consequence of this, as repeatedly demonstrated by the research we conducted at NIWA over the past 15 years, is that concentrations transition from very low to very high over very short distances around and within these small towns. This makes judging the state of air quality in any town critically dependent on where the monitor may be located. Our Regulations require air quality to be monitored where it is expected to be worst. But how do you know where that location is going to be in advance of monitoring? Considering, also, that you cannot locate a monitoring site just anywhere, and we have seen over the years that “missing” the “worst location” by even a hundred metres or so can yield data that substantially under-estimates the true nature of air quality in the airshed. It also introduces an uncertain bias that makes it very hard to compare airsheds fairly.
For decades, the best available approach to solving this was dispersion modelling – allowing the mapping of estimated air quality across an airshed. But his method is fraught with difficulty and especially uncertainty – models are at their weakest when trying to predict dispersion in low wind conditions as nocturnal boundary layers are forming and the timing of emissions (which homes are lighting fires when) has a highly random component. This is exactly the situation that leads to worst-case air quality in most New Zealand airsheds.
If your goal, though, is to understand current air quality (as opposed to predicting future air quality) dispersion modelling is only needed if you can’t monitor everywhere. But what if you can? When it comes to the king of particulate matter that arises from solid fuel heating that moment has now arrived.
Reliable, stable, repeatable measurements are now possible from small-form and self-contained monitors that can be installed anywhere there is a pole, fence or any stable structure. And they are available at a cost of one, or even two orders of magnitude lower than a conventional air quality monitoring station.
The only question now becomes – what do you do with the cost saving? Of course, you could simply save it! But that would be a huge missed opportunity as it does nothing to solve the problem of biased site selection. Much better is to use some of the saving to establish a network of monitors to provide the otherwise “missing” spatial information. The question then becomes – how many, in what formation, and for how long?
Diffuse emission sources, like home heating, is best captured using a regular rectangular grid of monitors. We recommended a minimum grid of 3 x 3 for the smaller towns, whereas a 4 x 4 grid or denser is preferred and also enables spatial interpolation methods to be used to create contour maps. Other grid shapes are available for irregularly shaped urban areas. It is not uncommon for peak concentrations to be found near the urban edge (especially where there is a persistent wind direction at times of high emissions) and where this is suspected, monitoring grids may extend beyond the urban edge.
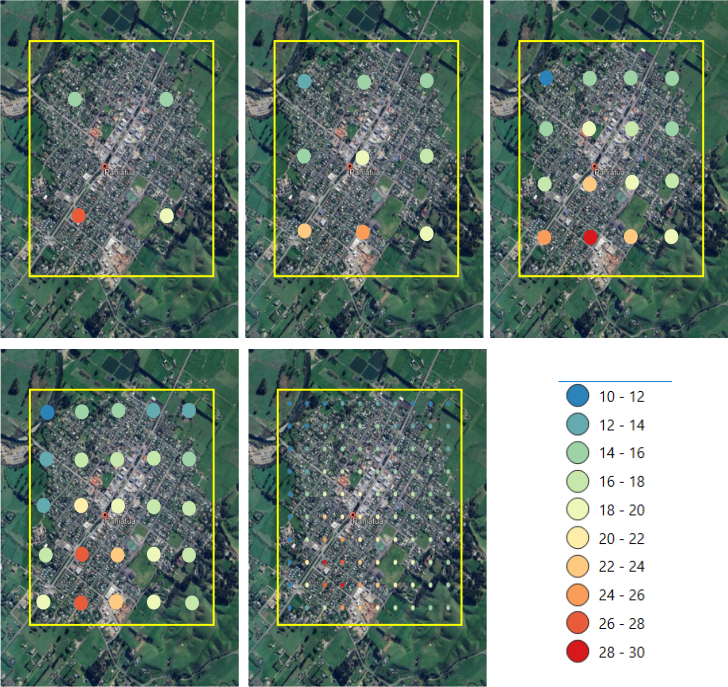
The denser the monitoring grid, the more precisely you can identify the location of peak concentrations.
Our past research has shown that one month of winter data is usually sufficient to uncover persistent spatial patterns of air quality, but that a 3-month campaign covering April to June or July to September is preferred, and also allows two airsheds to be mapped per winter. Once that initial mapping is complete, decisions over ongoing monitoring can be taken on a much surer footing. The simplest option would be to decide whether to continue monitoring at the “worst” location (as per the Regulations) using either a standard-compliant regulatory instrument (if a breach of the National Environmental Standards was considered likely), or maybe with a low-cost instrument (if a breach is not considered likely, but further data is considered valuable. However, a further option (which we present in the report) can include enabling community-owned “third party” monitoring, either alongside, or in place of Council monitoring. This is more likely in locations where the initial screening revealed concentrations of community concern, and can be a smart approach if the need for public support for future policy action can be foreseen.
We applied these principles in our proposed monitoring plan for Horizons Regional Council. They had 10 towns of interest, ranging from the cities of Palmerston North and Whanganui (populations 92,000 and 45,000 respectively) to small towns like Woodville (1,700). Very little, if any, monitoring had previously been conducted in any of these towns.
We proposed a staged monitoring plan to be executed over 3 to 5 years, at the end of which all 10 airsheds would be comprehensively mapped, worst locations identified, community-owned monitoring encouraged and the need and locations for ongoing compliance monitoring established. All (roughly) for the cost of running one regulatory instrument.
At the time of writing Horizons has commissioned the first part of the plan – a pilot screening campaign in the town of Woodville. We’re also working on two innovations to reduce costs – firstly by experimenting with two new low-cost sensors that have come onto the market, and developing resources to enable volunteer installation. But more on that another time.